
How to get the most out of your accounting software
By Dot Ruck and Cameron Andrich

Today, businesses are entering so much information into their accounting system but, are businesses actually doing anything with that data? For many businesses the answer will be ‘I only do it for BAS and tax’ or ‘Only for my accountant’.
As the transition for all accounting procedures to the cloud is almost complete and competition between software providers increases, so does the prevalence of non-compliance functionality of these cloud-based solutions. In this article, we discuss the two major competitors in the space, being MYOB and Xero.
MYOB
MYOB has recently upgraded their systems. So whether you are using Essentials or AccountRight, they can be accessed via a web browser such as Microsoft Edge or Google Chrome. MYOB have designed their tools so both are functionally the same product when viewing via a web browser.
The first page you see when you log in is the business dashboard. This gives a brief overview of how a business is currently going. Currently the dashboard is not able to be edited and the information you can get and use from the dashboard are:
Monthly sales and purchases and graphical comparison against last year
Open invoices and bills
Overdue invoices and bills
Graphical visual of income, expenses and net profit over a financial year

There are also a large range of reports that can also be used by businesses to make informed decisions and track performance. The most well-known being the profit and loss report. To make reports more useful in MYOB you are able to add more information to enrich the report such as: Year to date figures, last year comparison and percentage of sales analysis. Once a report is to your liking, you are able to save a template as a custom report so you can come back to it periodically without having to play with the settings every time.
Xero
While Xero also has a dashboard, it is more useful primarily for the bookkeeping side of things with most of the screen real estate taken up by the bank accounts. Xero’s dashboard does however, give you the ability to hide/show certain items. In addition to bank account summaries, you are also able to track debtors and creditors, view the cash in and out over the past 6 months, and finally, have the ability to track transactions grouped by categories.
Xero’s main offering regarding gaining insights from your own data is from their business analytics module of which there is a free version and a paid version. Both versions currently comprise two components - short-term cashflow and business snapshot.
Short-term cashflow allows you to track cashflow, in turn allowing you to project bank balances, see the impact of invoices and bills and know which invoices are the most urgent.
The business snapshot, well, gives you a current snapshot on the performance of the business. The metrics that the snapshot covers include profitability, efficiency and financial position, all displayed via beautiful visuals.
There is not much editing functionality when using the free version, other than choosing the date range from year-to-date, last month, last quarter and last financial year.
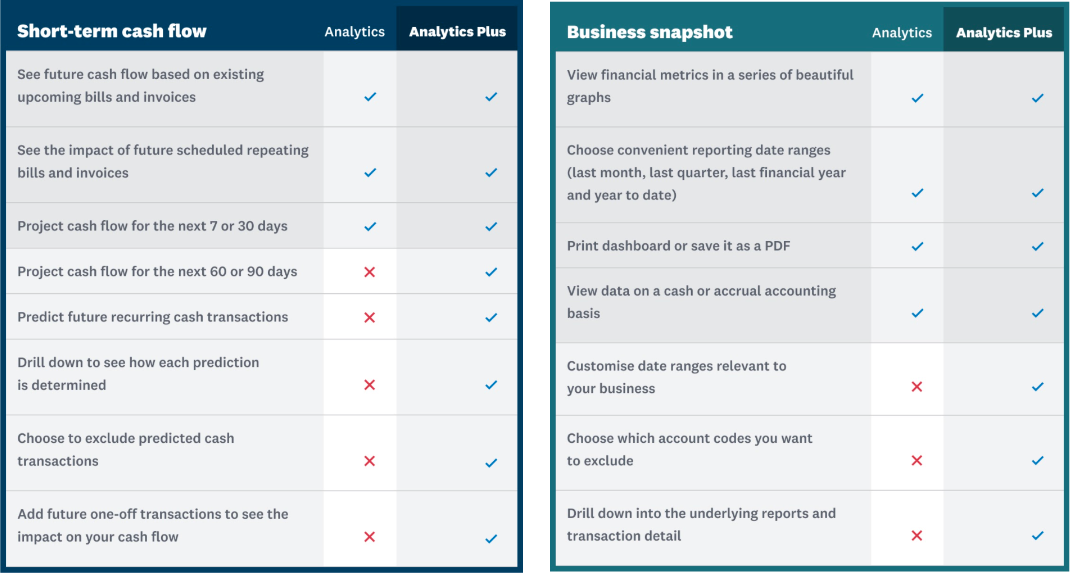

Upgrading to the paid version, called ‘Analytics Plus’, costs $10 a month on top of your usual subscription and which enables extra features for both components. For the short-term cash flow, the paid version enables:
management of future events with basic scenario planning
increase of time for projections to 90 days from 30 days
AI-powered predictions.
For the business snapshot the paid version gives you:
performance at the transactional level
ability to select custom date ranges
the ability to select the metrics to track within the snapshot.
What we have outlined below is only the in-built functions for these two main software providers. When we talk about tracking performance via visuals, we are entering the realm of business intelligence.
If you are willing to make the investment, we are able to utilise business intelligence specific software to create custom reports specialised to your business which may even to bring in data from your other softwares such as your Customer Relationships Management System (CRM) or Point of sales system (POS). If you would like to discuss your business intelligence options whether directly in your software or via business intelligence software, please speak with your Accountant or Manager, call us on 9841 1200 or email us at info@lincolns.com.au.
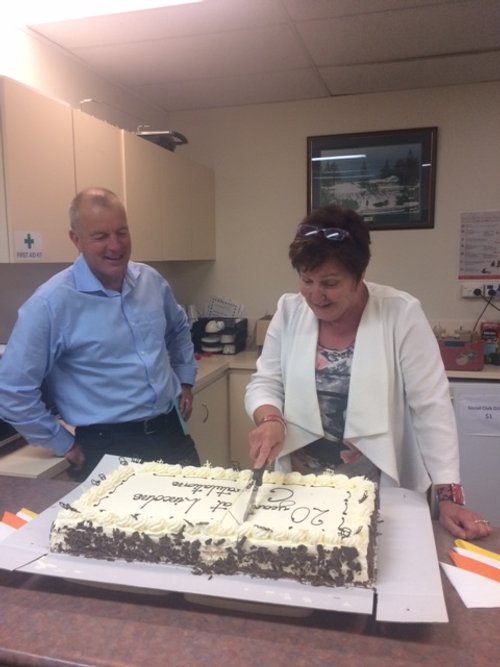
Wishing Jan Walker a happy retirement
After a Lincolns career spanning 25 years, this month we bid a sad farewell to our team member, Jan Walker.


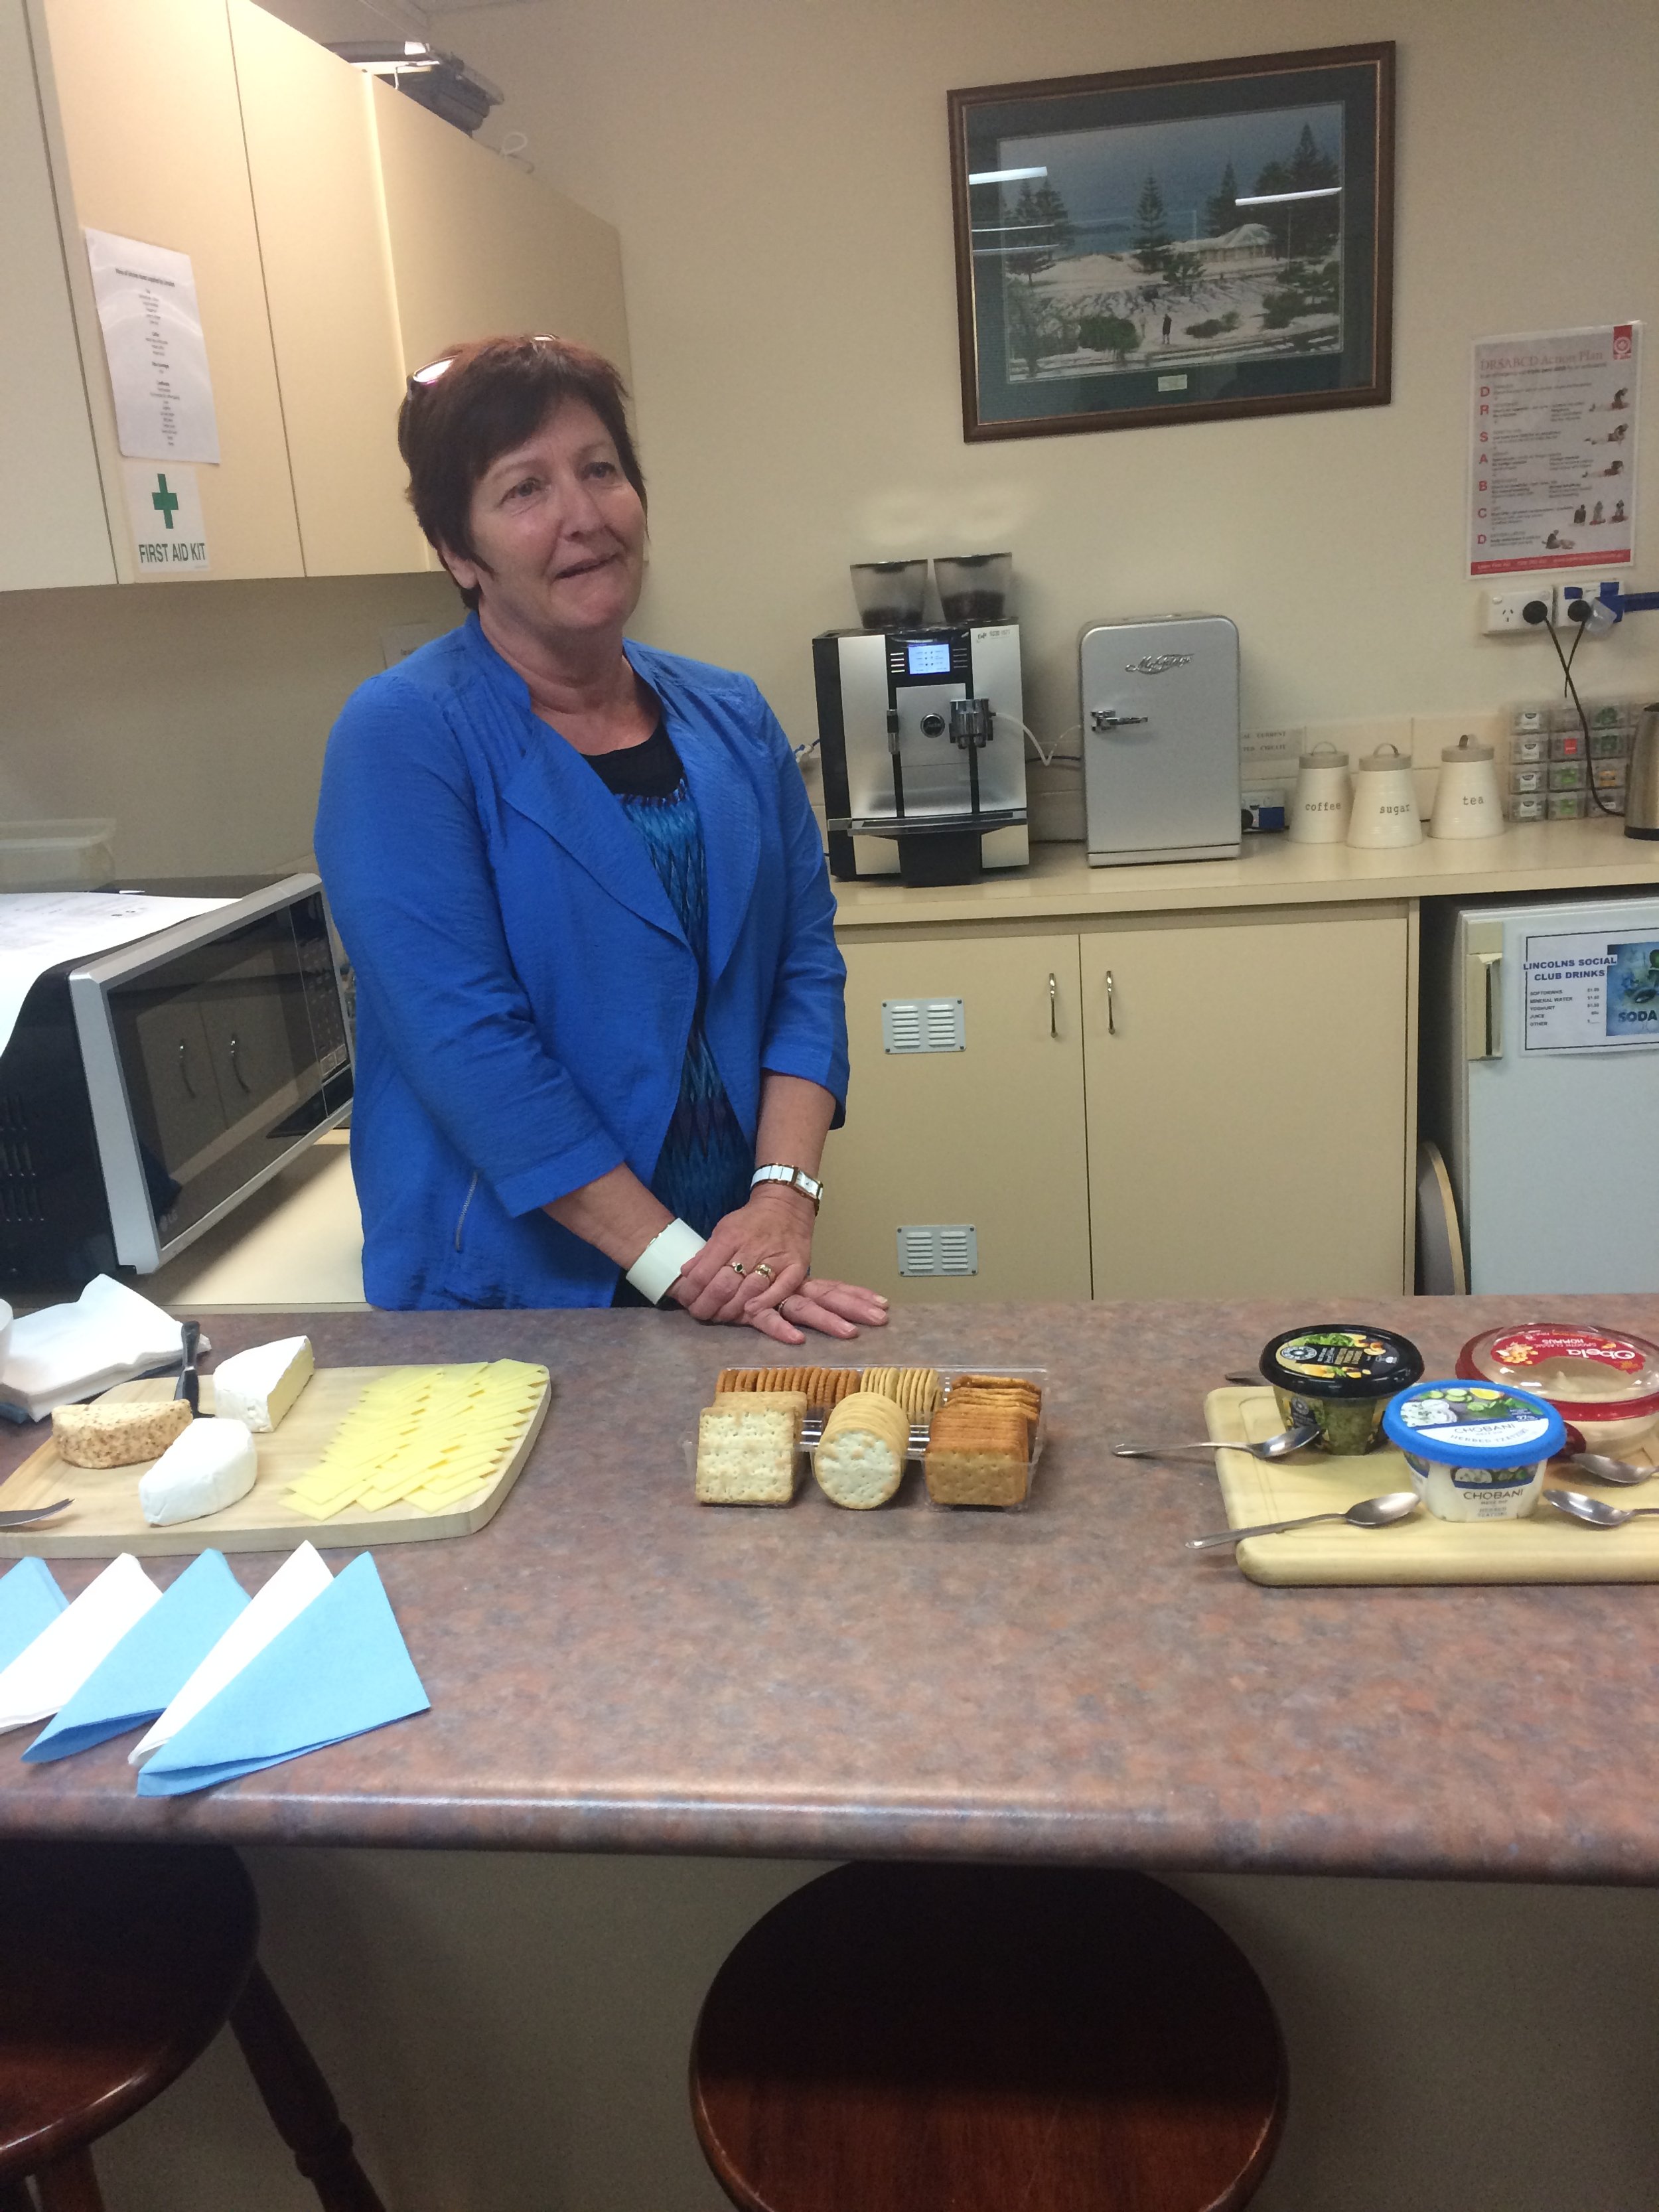


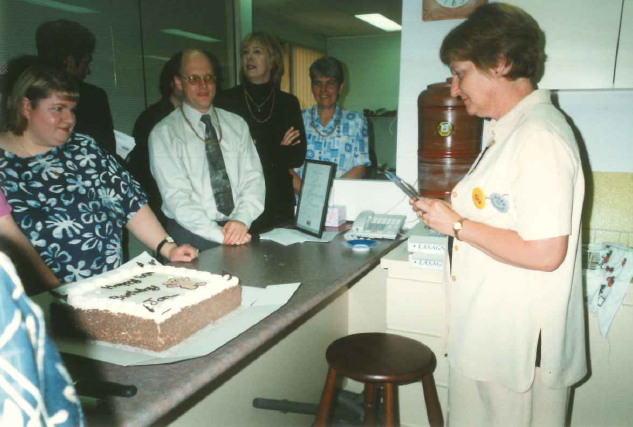


Jan started with us in 1997 as a PA to our Partners. Over the years her role has evolved with the times to what it is today as the principal Lincolns team member responsible for our Corporate function. Many of you will have dealt with Jan over the years – from setting up companies and trusts to processing your annual returns and getting you to fill and sign the myriad of ASIC forms that she knows so well.
We are all going to miss Jan, she’s been a stalwart of the Lincolns team for such a long time. We will also dearly miss seeing Jan’s amazing shoe collection and the infectious joy she spreads around the office at Christmas time.
Jan, it is now time for you and Chris to enjoy some well-deserved R&R in your retirement. Wishing you a happy, healthy and relaxing retirement with loads of fun things on the horizon.